User activity within your own company in the form of logs is incredibly valuable data. System failures or performance statuses also provide rich information about the quality of a network or a product. However, the manual collection of all such actions, both from people and machines, is in most cases a very complex task.
ELK is a technology stack that Elasticsearch, Logstash and Kibana combined to provide a comprehensive approach to consolidating, managing and Analysing logs and protocols from your entire company. It allows Real-time insights into network processes, firewall activities, domain controller log data and also carries out automated and continuous security analyses.
Centrally collect, search, automatically analyse and evaluate all events and log data and trigger alarms as soon as security problems or unauthorised processes are detected.
The centrepiece - Elasticsearch
As Main component of an ELK stack comes Elasticsearch as the centrepiece and in the productive environment in the form of a cluster. It serves as Databasethe Storage location of all data stored in separate log indexes, Indices can be subdivided. This is also where the monitoring cluster comes to life. All storage and searches, whether automated or manual, are carried out here via API requests and bilateral communication between the cluster member nodes.
Since Elasticsearch is very extensive, we publish under: Elasticsearch - The High Performance Search Engine a separate post about this.
The normalisation of logs by Logstash
The integration of custom systems, as is often the case with larger industrial companies such as gas, water or electricity companies, often requires the logs to be normalised. This means that the log data produced by the different devices must first be converted into a standardised format that can then be imported into the Elasticsearch cluster. This applies in particular to technologies that are not already supported by the official data shippers like Filebeat, Winlogbeat, Auditbeat, Metricbeat or Packetbeat are covered.
- A fleet server would also be a good option, Perimeter firewalls or other log sources into Elasticsearch.
- Existing integrations can be found under the following link: Fleet agents.
With Logstash, it is possible to use self-created Pipelines and so-called GROK patterns also possible to create your own log files, such as e.g. a self-created Python script, in Searchable Fields and to map them in Elasticsearch index (save in Elasticsearch). For example, as with Regex, GROK can be used to select all usernames or IP addresses from a special log file and then analyse them using a Key value matchings in the JSON format can be preselected for Elasticsearch. The finished mapped log file is imported into Elasticsearch at the end of the pipeline.
The topic of Logstash, as well as the basic principle of pipelines, will be published in a separate post at a later date for a deeper understanding: Logstash - The log pipeline.
The Kibana user interface
Below you can see some screenshots of Kibana in productive use. Kibana used to be developed as a stand-alone product, today it is the graphical Surfaceso the Web UI from Elasticsearch and would no longer function independently without Elasticsearch.
At the end of this blog entry you will also find a few manufacturer demos of what data visualisation with Kibana could look like.

There are countless ways to index data in Elasticsearch:
- Beats Data Shippers
- Filebeat - Everything that comes in the form of log files, e.g. Apache, Nginx, Linux messages, Audit.log, etc.
- Winlogbeat - All Windows event log messages and various extensions, e.g. PowerShell entries etc.
- Auditbeat - Security-relevant messages, login attempts, e.g. on Unix systems
- Packetbeat - Network activities, latencies or network problems
- Logstash
- Syslog - Input, the network port is freely configurable
- Kafka - Input and output, the network port is freely configurable
- RabbitMQ - Input and output, the network port is freely configurable
- ⇒ Complete list of logstash inputs
- Fleet server
- All integrations under the following link: Fleet integrations
Elasticsearch is a as-is database. This means that All mappings of data and fields must take place before the final indexing. For standard products that are known worldwide, e.g. Palo Alto firewalls, Cisco products, web servers, Windows systems, Linux system logs, no additional preparation with GROK is required in most cases, as all fields are already assigned correctly automatically for such technologies.
If this is not the case, this can be done straightforwardly with Logstash especially if it is an in-house development.
- More about: How a Logstash pipeline works
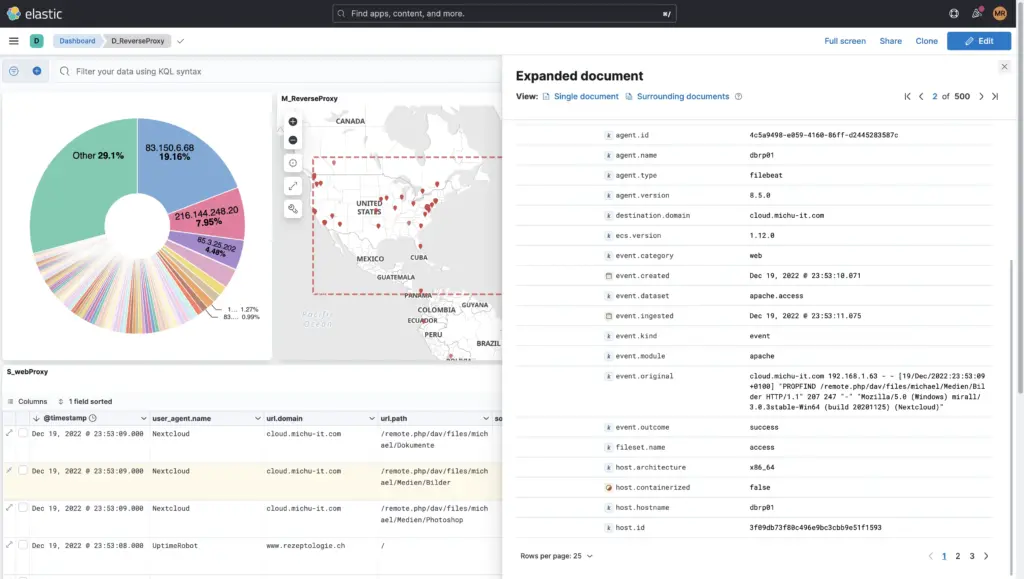
The data or logs can be viewed in the menu "Discover" can be analysed and searched.
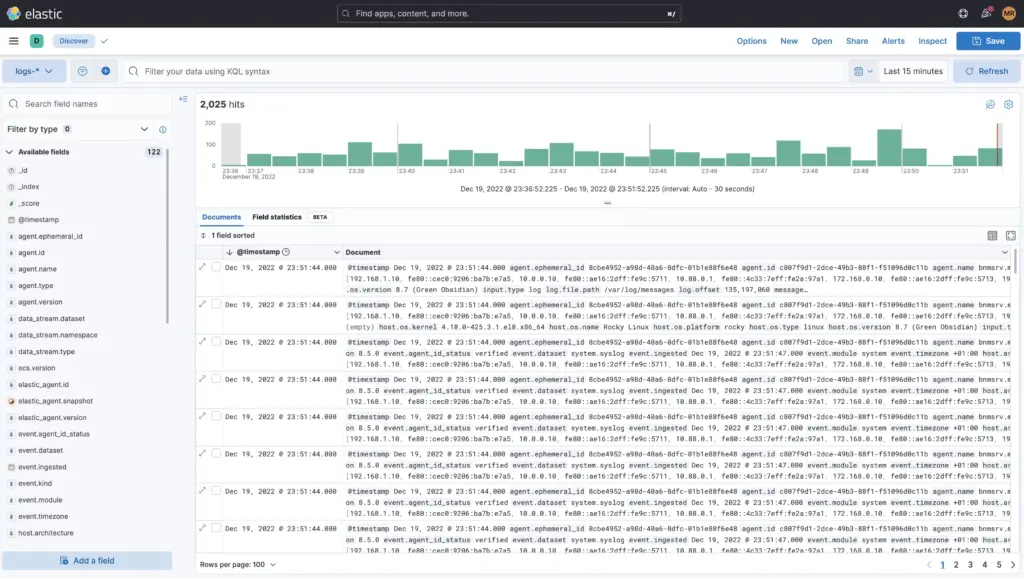
This can be done by excluding event categories or by explicitly including them, such as searching for the tag Access Denied or 403 and much more. You can also use the KQL (Kibana Query Language) are needed or for courageous Apache-Lucene.
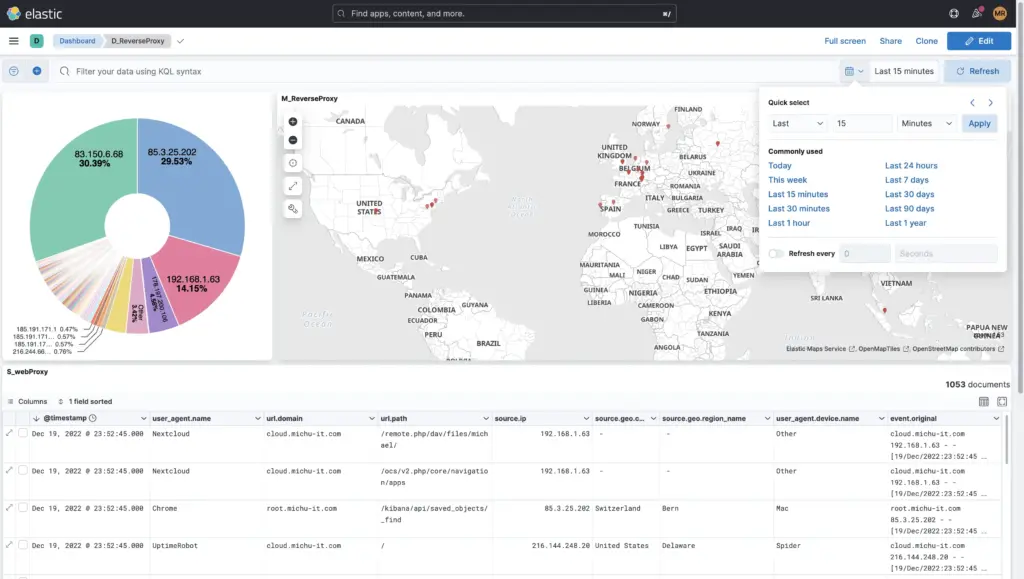
Furthermore, the time period can be limited in fine granularity or a specific date within a time period can be searched for to the millisecond. Additional filters such as only the logs from the firewall etc. can also be added here.
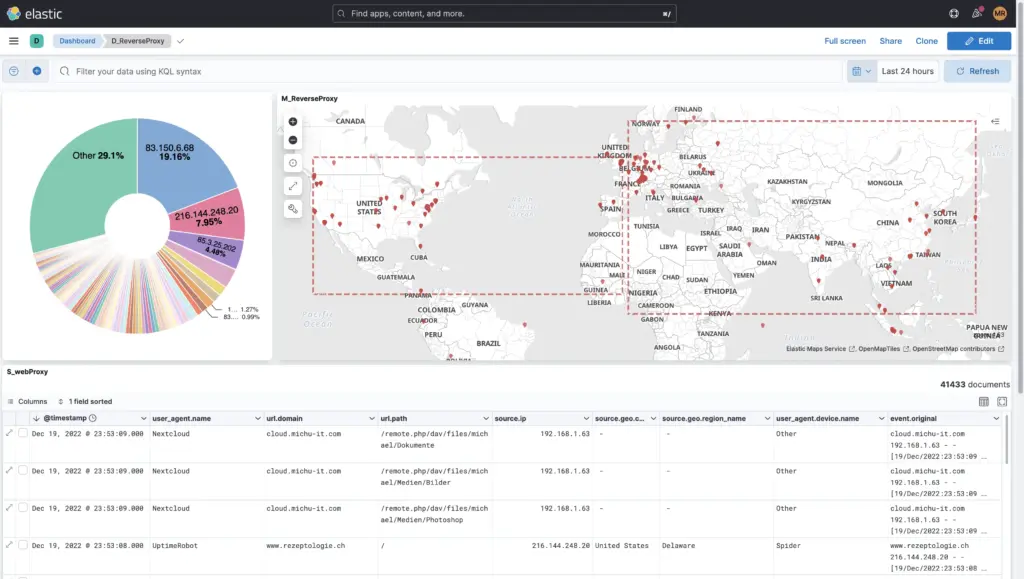
Under Dashboards you will find over 40 default dashboards, which already come with Elasticsearch and its beats. These can be customised, copied and saved or saved under a new name.
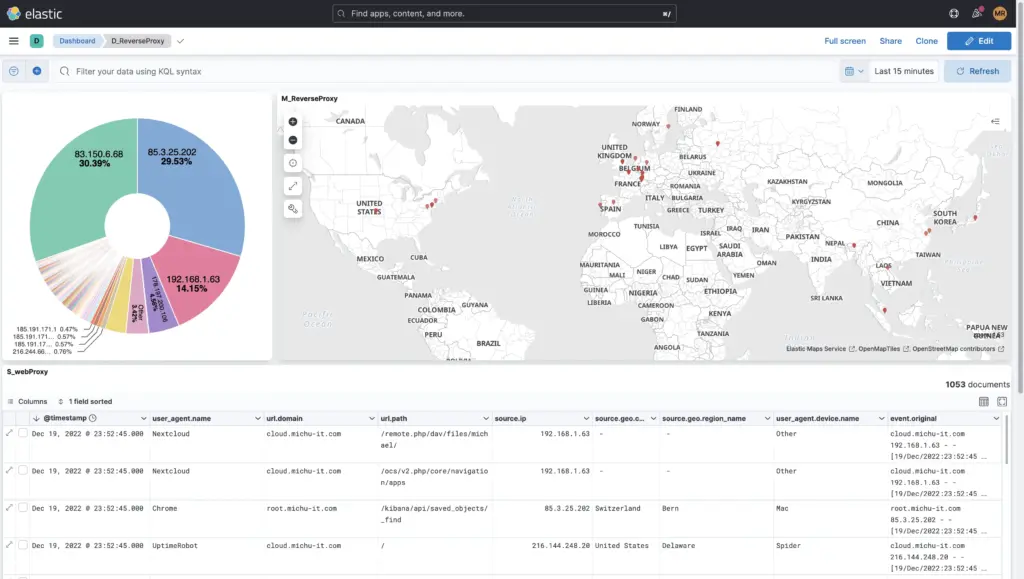
Of course you can also Own dashboards from-scratch, as the example of this reverse proxy shows:
Logs need storage space. Depending on the company and firewalls, this can amount to up to 150 GB per day. It makes sense to consider how long the data should be searchable and when it can be archived or even deleted. There are four lifecycle phases for this, which can be easily defined in a lifecycle policy for each index or globally:
- Hot phase
- Here you can find the live data.
- Indexing and active searches are carried out here.
- Best performance on local or even SSD storage
- Warm phase
- The warm phase is there if you want to search logs for longer, but want to move them to more favourable storage after a certain time.
- Example: After 20 days, all logs should be automatically moved from the SSD storage to an NFS share, i.e. moved to the warm nodes.
- These logs can still be actively searched if a longer period of time is searched, e.g. over the last 90 days (search in hot and warm).
- Cold phase
- This phase is for archiving purposes only.
- It can no longer be actively searched. In order to search the data again, it would first have to be reindexed in a temporary index; use cases are banks that want to keep logs for 10 years.
- Delete phase
- Logs that reach this phase are deleted from the cluster.
Important to mention: It is never necessary to define all phases. There can also only be a hot phase of 30 days and then the delete phase immediately afterwards.